

What is a Business Impact (BI) Score?
Contents
The same CVSS 9.0 vulnerability lands very differently on a payment platform than it does on a test box waiting to be decommissioned.
The Business Impact (BI) Score puts a number on that difference from the asset side, so it can be multiplied against technical severity.
The BI Score is the sum of three axes, an integer from 5 to 13
Purpose, data classification and availability each carry a value, and their sum is the BI Score. Because the axes span different widths, the total bottoms out at 5 and tops out at 13.
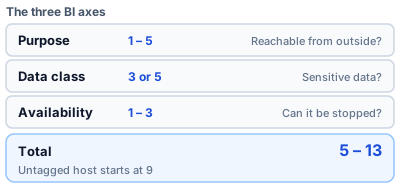
Figure 1: The width of each axis, and the range the total falls into
Deep dive: where the ceiling and the floor come from
The maximum of 13 needs all three at once: publicly exposed (purpose 5), sensitive data (classification 5) and round-the-clock operation (availability 3). The minimum of 5 comes from decommissioned (purpose 1), public-only data (classification 3) and safe to stop (availability 1). With no tags at all, each axis falls back to 3 and the host starts at 9.
Data classification is the one axis that cannot say "no business impact"
Purpose and availability both go down to 1, while data classification stops at 3. Even a host that only serves public content is never treated as weightless.
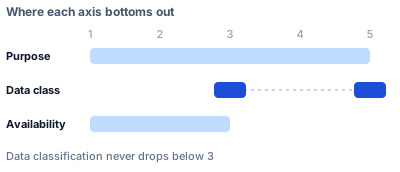
Figure 2: Only data classification has its floor held at 3
Deep dive: data classification has two steps, not five
Personal data, payment data or confidential scores 5; public-only or unclassified scores 3; nothing sits between them. That is a coarser step than purpose (five levels) or availability (three), but drawing a hard line on whether sensitive data is handled keeps the judgment from drifting.
Three tags are the whole interface, and the score recomputes itself
Tag a host and the score is redrawn on the spot, all the way through to the TER band. What the team maintains is tags; nobody types in a number.
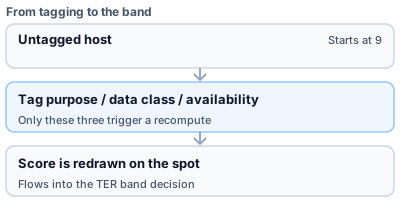
Figure 3: Tagging redraws the score, which feeds the band decision directly
Deep dive: which tags actually trigger a recompute
Only purpose, data_classification and availability trigger it; adding or removing any other tag leaves the score untouched. Removing one of the three resets just that axis to its default of 3 and recomputes.
The score collapses into three tiers and becomes the business axis of TER
The 5-to-13 integer is not used directly; it folds into high, medium and low. The cuts sit at 10 and 5: 11 and above is high, 6 through 10 is medium, and only 5 is low.
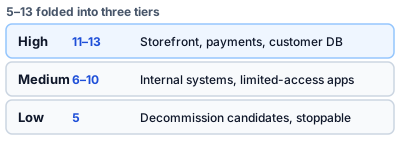
Figure 4: The 5-to-13 integer folded into three tiers
Deep dive: the default of 9 lands in the middle tier
An untagged host starts at 9, so doing nothing leaves it treated as medium BI. Lifting a heavy asset to high, or dropping a decommission candidate to low, both take a deliberate tagging step.
The same vulnerability changes rank depending on what it sits on
Identical technical rank, different BI, different band. One CVSS 9.0 vulnerability with a high exploitation probability comes out as S on a high-BI host and B on a low-BI one.
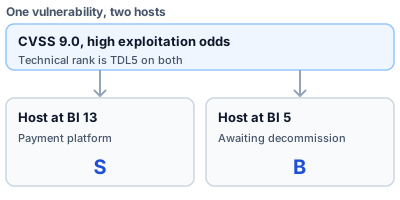
Figure 5: Same technical rank, different destination by asset weight
- Threat Exposure Risk: technical risk multiplied by business risk
- What is the Threat Discovery Level (TDL)?
- CVSS, EPSS and KEV: how to read each score and when to use it
- What is CTEM? How it differs from traditional vulnerability management
Scoring your own assets and re-ordering the queue is free to try for 14 days.
Appendix: values and tags for the three axes
Table 1: purpose — 1 to 5
| Value | Tag | Examples |
|---|---|---|
| 5 | public / remote_access | Public web, API, VPN |
| 4 | restricted / mail_infra | Limited-access systems, mail |
| 3 | development / unknown | Dev environment, unclassified assets |
| 2 | internal_only | Internal-only systems |
| 1 | archived | Decommissioned or pre-restart systems |
Table 2: data_classification — 3 or 5
| Value | Tag | Examples |
|---|---|---|
| 5 | personal_data / payment_data / confidential | Customer data, payments, restricted data |
| 3 | public_only / unknown | Public-only content, unclassified |
Table 3: availability — 1 to 3
| Value | Tag | Examples |
|---|---|---|
| 3 | mission_critical / unknown | Round-the-clock systems |
| 2 | business_hours | Operating during business hours only |
| 1 | non_critical | Back office, temporary systems |
Table 4: the boundary totals
| Total | Breakdown | Meaning |
|---|---|---|
| 13 | 5 + 5 + 3 | Public system × sensitive data × round-the-clock |
| 9 | 3 + 3 + 3 | Default for an untagged host |
| 5 | 1 + 3 + 1 | Decommissioned × public-only × safe to stop |
The values above were checked against PentaTrail's own scoring routine on 2026-08-17.
Visualize your attack surface with PentaTrail CTEM/ASM
From discovery to vulnerability validation and remediation — all powered by the CTEM framework.
Get Started