Threat Exposure Risk: Integrating Technical Risk and Business Risk
Table of Contents
What is Threat Exposure Risk?
Threat Exposure Risk (TER) is the risk assessment framework adopted by PentaTrail/CTEM. It integrates technical threat severity with business impact to quantify the true risk an organization faces.
Traditional security assessments tend to focus solely on technical severity. TER, in contrast, enables risk decisions from a business perspective.
Why Traditional Risk Assessment Falls Short
Over-reliance on technical severity
A CVSS score alone cannot determine the business impact of a vulnerability. A CVSS 10.0 vulnerability in a private test environment causes far less harm than a CVSS 6.0 vulnerability in a production system handling customer data.
Siloed perspectives
Security teams assess technical risk while executives judge business risk. When these two views are disconnected, sound decisions are impossible.
Confusion in prioritization
When multiple scores (CVSS, EPSS, Evidence Grade, etc.) are shown side by side, the question "what should we tackle first?" becomes unclear.
How TER Is Built in PentaTrail
TER combines TDL (Threat Discovery Level) with the BI Score (Business Impact).
Axis 1: TDL (Threat Discovery Level)
TDL maps each vulnerability to one of 5 discrete levels: tdl5 is the most critical, tdl1 is minor.
The base TDL is derived from CVSS and EPSS:
| Condition | TDL |
|---|---|
| CVSS ≥ 9 and EPSS ≥ 0.1 | tdl5 |
| CVSS ≥ 9 | tdl4 |
| CVSS ≥ 7 and EPSS ≥ 0.1 | tdl4 |
| CVSS ≥ 7 | tdl3 |
| CVSS ≥ 4 and EPSS ≥ 0.1 | tdl3 |
| CVSS ≥ 4 | tdl2 |
| EPSS ≥ 0.1 | tdl2 |
| Otherwise | tdl1 |
The effective TDL is computed by applying three corrections to the base TDL.
Evidence Grade adjustment
Evidence Grade is a 4-level (A/B/C/D) indicator of detection evidence quality. Findings detected by multiple sources or confirmed through active validation receive Grade A (highest). In contrast, findings backed only by external CVE data fall into Grade C or D. TDL is lowered by up to 3 levels based on the Grade, suppressing the impact of false positives.
AI Deep Scan result reflection
PentaTrail runs AI Deep Scan to actively verify vulnerabilities on each target. The result is reflected in TDL in two directions.
- Confirmed findings: treated as Evidence Grade A, retaining high priority
- Unconfirmed findings: TDL is lowered by 1 level. The reasoning: "the issue is likely unreachable from outside or already silently patched," which reduces the response urgency
KEV boost
KEV (Known Exploited Vulnerabilities) is a catalog maintained by CISA listing vulnerabilities actively exploited in the wild. Findings in KEV are not theoretical risks—they have proven attack vectors. TDL is therefore raised by 1 level to emphasize their priority.
The final effective TDL is clamped between tdl1 and tdl5. Dedicated articles on Evidence Grade, AI Deep Scan reflection, and the KEV boost will follow.
Axis 2: BI Score (Business Impact)
The BI Score represents an asset's business importance as an integer between 5 and 13. Untagged assets default to 9.
The implementation sums three axes:
| Axis | Range | Examples |
|---|---|---|
| purpose | 1–5 | public system = 5, internal-only = 2, archived = 1 |
| data_classification | 3–5 | personal/payment/confidential data = 5, public-only = 3 |
| availability | 1–3 | mission_critical = 3, business hours = 2, non-critical = 1 |
The minimum total is 5 (lowest purpose + public-only data + non-critical availability) and the maximum is 13 (public system + confidential data + 24/7 availability).
Combined: TER bands
TER classifies each combination of TDL and BI Score into one of 5 bands (S/A/B/C/D).
| TDL \ BI | 1–5 (low) | 6–10 (mid) | 11–13 (high) |
|---|---|---|---|
| tdl5–tdl4 (high TDL) | B | A | S |
| tdl3–tdl2 (mid TDL) | C | B | A |
| tdl1 (low TDL) | D | C | B |
Band semantics
| Band | Target SLA | Example |
|---|---|---|
| S - Critical | within 24 hours | RCE on a core system (KEV-listed) |
| A - High | within 1 week | High-risk vuln on customer-facing system |
| B - Medium | within 1 month | Medium-risk vuln on internal system |
| C - Low | next patch cycle | Low-risk vuln in low-BI environment |
| D - Info | monitor only | Minor finding in minimal-BI environment |
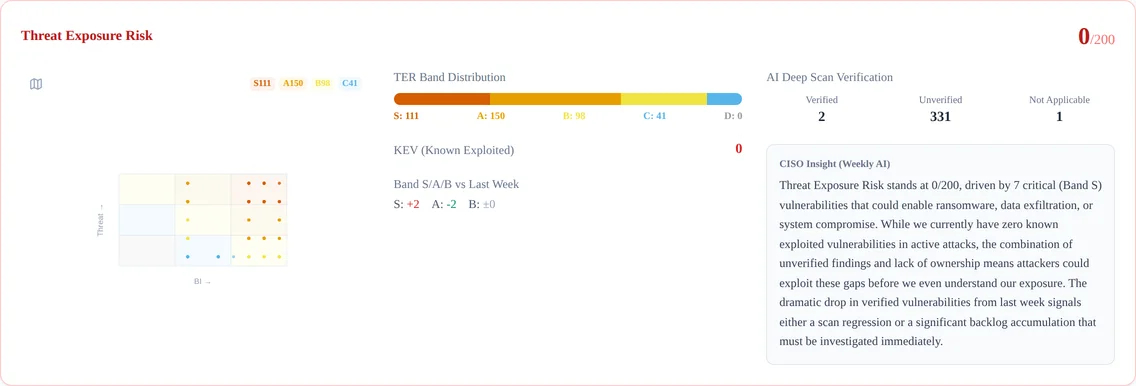
TER Map — See Your Risk Posture at a Glance
Knowing how TER bands are computed isn't enough on its own. You still need to see "how many S- and A-band findings do we have right now, and which assets are they concentrated on?" PentaTrail visualizes this whole picture as the TER Map (Threat Exposure Map).
Where the map appears
The TER Map is shown in both the Executive Dashboard and the Mobilization screen. It first appears as a compact mini map and expands when clicked. Each dot on the map represents one finding detected on one asset.
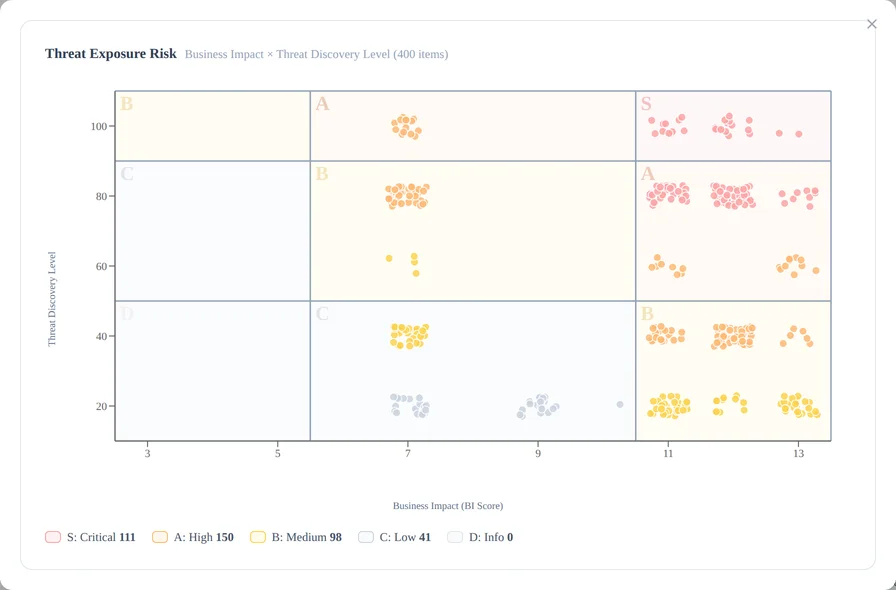
How to read the map
The TER Map is a 2-axis scatter plot.
| Axis | Meaning |
|---|---|
| Horizontal (X) | BI Score (5–13, higher = more critical asset) |
| Vertical (Y) | Effective TDL (tdl1–tdl5, higher = more severe) |
| Color | TER band (S/A/B/C/D, designed for color-vision accessibility) |
A faint 3×3 grid is drawn in the background. Dots clustered in the top-right cells lean toward the S band (severe threats on critical assets), and dots in the bottom-left cells lean toward the D band (minor findings in minimal-BI environments).
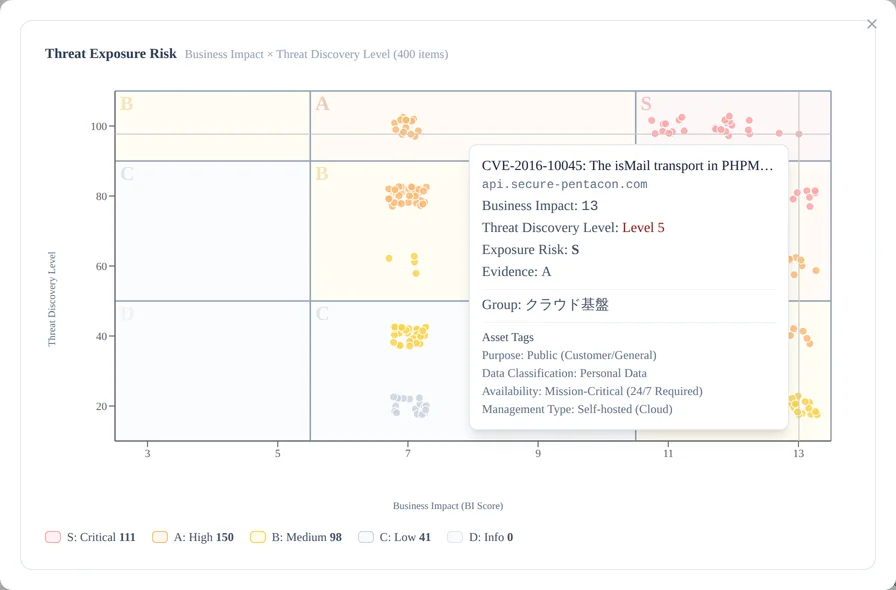
Hovering a dot reveals the finding's CVE, target FQDN, BI Score, effective TDL, band, Evidence Grade, owning group, and asset tags. Once you've identified where dots are concentrated in the upper-right, you can drill straight down into "which asset and which vulnerability specifically?".
What it means for executives
Think of the TER Map as an "X-ray of your security posture."
- Concentrated in the top-right → severe threats are concentrated on critical assets → priority area is clear
- Scattered everywhere → risk is spread thin and wide → systematic uplift is needed
- Concentrated in the bottom-left → already addressed or remaining issues are minor → healthy posture
For executive reporting, pairing the band-by-band count trend (week over week) with the KEV count makes it easy for non-specialists to grasp "which severity level is rising or falling."
Relationship to the CTEM Framework
TER fits within the Prioritization stage of the 5-phase CTEM framework.
- Scoping: define what to protect → set BI Scores
- Discovery: find assets and vulnerabilities → collect CVSS / EPSS / Evidence Grade
- Prioritization: compute TER → here
- Validation: verify high-risk items
- Mobilization: drive remediation
Reporting to Executives
The biggest advantage of TER is that it expresses risk in a form executives can act on.
Example reports
- "Three Critical (S-band) threats are concentrated in our core e-commerce system."
- "High (A-band) and above threats decreased by 40% compared to last month."
- "Among newly discovered vulnerabilities, 12 have significant business impact."
This avoids technical jargon while pointing to clear actions.
Summary
TER is a "common language" that integrates technical and business risk. When security teams and executives use the same metric, the organization's overall security posture improves.
A dedicated article on Evidence Grade — the indicator of detection evidence quality — will follow.
If you'd like to start TER-based management with PentaTrail/CTEM, Start Your 14-Day Free Trial.
Visualize your attack surface with PentaTrail/CTEM
From discovery to vulnerability validation and remediation — all powered by the CTEM framework.
Get Started