
What is the Threat Discovery Level (TDL)? Ranking vulnerabilities with CVSS × EPSS
Contents
Of the vulnerabilities that get published, only 1.5–3% show any sign of exploitation in a given 30-day window (FIRST's observation). Working strictly down a severity-sorted list means starting with the ones nobody is coming for.
The Threat Discovery Level (TDL) multiplies severity by exploitation probability, folds the result into five ranks, and then adjusts for how well the finding is evidenced and what active verification found.
TDL folds severity and exploitation probability into five ranks
Two inputs decide it: the CVSS band, and whether EPSS is at or above 0.1. At the same CVSS, crossing 0.1 on EPSS moves the finding up one rank.
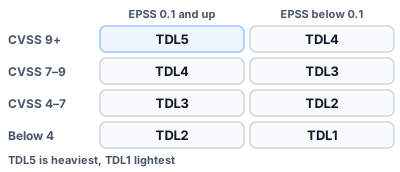
Figure 1: The grid that sets the base TDL (TDL5 is heaviest, TDL1 lightest)
Deep dive: when neither score is present
A finding with no CVSS and no EPSS falls back to the severity the scanner reported: critical becomes TDL4, high becomes TDL3, medium becomes TDL2, anything else becomes TDL1. Findings marked info skip the grid entirely and drop out of prioritization.
Three adjustments turn the base TDL into the effective TDL
What the dashboard shows is not the base value but the effective one, after evidence quality, verification results and real-world exploitation are folded in. Two adjustments push down, one pushes up.
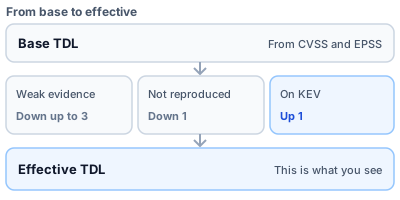
Figure 2: Two adjustments push down, one pushes up
Deep dive: the two downward adjustments never stack
Weak evidence and failed reproduction measure different things: the first is how confidently the finding was detected, the second is whether anyone actually reached it from outside. But a finding that has been actively checked is, by that fact alone, treated as top-grade evidence. So when the one-rank verification drop applies, the evidence drop is zero — and the three-rank evidence drop only ever lands on findings nobody has checked yet.
Weakly evidenced findings drop by up to three ranks
Detection backing is graded A through D, and the weaker it is, the further the finding falls. Actively confirmed means no drop at all; external CVE data as the only basis means three ranks.
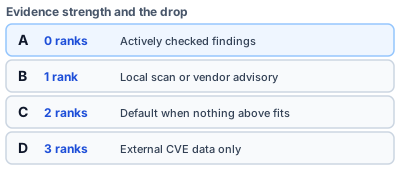
Figure 3: Evidence strength mapped to the size of the drop
Deep dive: D is reserved for backported-package hosts
External CVE data alone is not enough to earn a D. It applies on hosts running distributions that backport fixes into older version numbers (Debian, Ubuntu, RHEL and friends), where the version string alone cannot tell you whether the fix is in. On products whose version numbers can be read at face value, external data alone is treated as grade A.
A finding that fails an active check drops one rank; a proven-exploited one gains a rank
If an active scan cannot reproduce a finding, it is most likely unreachable from outside or already fixed. Vulnerabilities with a record of real-world exploitation move the other way, toward the front of the queue.
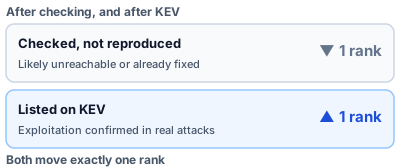
Figure 4: Which way a finding moves after checking and after KEV
Deep dive: why unreproduced findings are not deleted
Failing to reproduce something is not proof it isn't there. The scan path may simply have been blocked, or the vulnerable surface may sit behind a screen that needs credentials. So the finding stays in the list and only its rank moves down by one. Validating vulnerabilities with AI covers the mechanics.
Order matters: drops bottom out at TDL1, the lift stops at TDL5
The drops are summed and capped first, then real-world exploitation gives one rank back. A finding pushed all the way down to TDL1 still climbs back to TDL2 if it is on the KEV list.
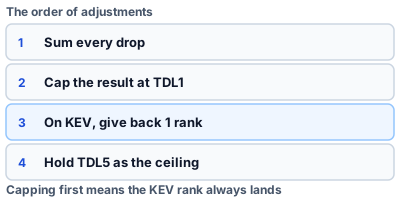
Figure 5: Drops are capped before the lift is applied
Deep dive: where the cap changes the answer
Take a CVSS 5.0 finding backed only by external CVE data. The base is TDL2, and the three-rank evidence drop would arithmetically push it past TDL1 — but it stops there, capped. The KEV lift of one rank then applies, so it settles at TDL2. Because the cap is applied to the drops only, the KEV rank is never swallowed no matter how far the drops accumulated.
TDL is the technical axis; multiplied by asset weight it becomes TER
TDL says nothing about which system the vulnerability sits on. Only when it is combined with the Business Impact (BI) Score does it become an order of work.
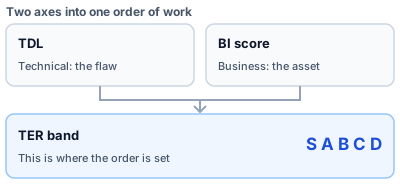
Figure 6: The technical axis and the business axis combine into an order of work
- Threat Exposure Risk: technical risk multiplied by business risk
- What is a Business Impact (BI) Score?
- CVSS, EPSS and KEV: how to read each score and when to use it
- Discovery Alone Won't Protect You: Confirming "Can It Actually Be Exploited?" with AI Deep Scan
Seeing where your own findings land on the TDL scale is free to try for 14 days.
Appendix: the decision tables and the effective rank
Table 1: base TDL decision table
| Condition | TDL |
|---|---|
| CVSS ≥ 9 and EPSS ≥ 0.1 | TDL5 |
| CVSS ≥ 9 | TDL4 |
| CVSS ≥ 7 and EPSS ≥ 0.1 | TDL4 |
| CVSS ≥ 7 | TDL3 |
| CVSS ≥ 4 and EPSS ≥ 0.1 | TDL3 |
| CVSS ≥ 4 | TDL2 |
| EPSS ≥ 0.1 | TDL2 |
| Otherwise | TDL1 |
Table 2: fallback when neither CVSS nor EPSS is present
| Scanner severity | TDL |
|---|---|
| critical | TDL4 |
| high | TDL3 |
| medium | TDL2 |
| Otherwise | TDL1 |
| info | Excluded from prioritization |
Table 3: evidence strength and the size of the drop
| Evidence | Drop | Main basis |
|---|---|---|
| A | 0 ranks | Detected by deep-scan tooling, or actively checked (including checks that did not reproduce) |
| B | 1 rank | Local scan, or a vendor advisory |
| C | 2 ranks | Default when none of the above applies |
| D | 3 ranks | External CVE data only, on a backported-package host |
Table 4: the order the effective rank is computed in
| Step | What happens |
|---|---|
| 1 | Add the evidence drop and the one-rank verification drop to the base rank |
| 2 | Cap the result at TDL1 |
| 3 | If the vulnerability is on KEV, give back one rank |
| 4 | Hold TDL5 as the ceiling |
Findings marked info skip this sequence entirely and stay out of scope.
The values in this post were checked against PentaTrail's own routines (asm_calc_priority and asm_recalc_confidence) on 2026-08-17.
Visualize your attack surface with PentaTrail CTEM/ASM
From discovery to vulnerability validation and remediation — all powered by the CTEM framework.
Get StartedRelated Articles

CVSS, EPSS, and KEV: Reading the Three Vulnerability Scores

The Fix Window Has Closed — Why 'Find It, Fix It Fast' Is the 2026 Default