What is a Security Score? PentaTrail's 400-Point Model for Quantifying Your Attack Surface
Table of Contents
What is a Security Score?
A security score expresses an organization's cybersecurity posture as a single number. By blending multiple indicators into one figure, it lets executives and security teams instantly grasp "what's working, what isn't."
The industry convention is a 0–100 single score, but PentaTrail extends this into a 3-axis composite on a 400-point scale. Single-score models leave a clear gap: when the score drops, you can't immediately see why. The 3-axis breakdown solves that.
PentaTrail's 400-Point Model
The Executive Dashboard shows a total score (out of 400) alongside three sub-scores.
| Axis | Points | Meaning | Key indicators |
|---|---|---|---|
| Threat | 200 | Total risk volume from detected vulnerabilities | TER band (S/A/B/C/D) counts and distribution |
| Management Maturity | 100 | How well asset information is maintained | Grouping Rate, Asset Classification Rate, Responsible Assignment Rate |
| Response Status | 100 | Health of the response process | Decision Rate, S Overdue %, ABCD Overdue % |
Each axis lifts or drags the total score.
Threat Score (200 points)
Starting from open / in-progress findings, the score is Base − three penalties. Penalties bite harder for higher-severity findings.
For each active host, take the worst (highest) TER band across its open findings and aggregate at the host level.
Base
The base subtracts from 200 based on counts of A-band and B-band hosts. S-band hosts are handled by a separate penalty (see below). C- and D-band hosts do not affect the base.
Base = 200 × (1 − (A_hosts × 0.5 + B_hosts × 0.1) / total_active_hosts)
S host penalty (breadth)
Penalty by distinct host count that have at least one S-band finding. If a single finding affects multiple hosts, every host counts. The wider S-band exposure spreads, the heavier the penalty.
| S hosts | Penalty |
|---|---|
| 0 | 0 |
| 1 | −60 |
| 2–3 | −110 |
| 4–10 | −150 |
| 11–30 | −180 |
| 31+ | −200 |
S finding count penalty (density)
Penalty by distinct finding count classified as S band — an independent axis that captures how many S-band findings stack up on individual hosts.
| S findings | Penalty |
|---|---|
| 0–5 | 0 |
| 6–20 | −10 |
| 21–50 | −25 |
| 51–100 | −50 |
| 101+ | −80 |
The two axes differ: one critical CVE spread across 10 hosts (host penalty −150, count penalty 0) and 10 distinct critical CVEs stacked on a single host (host penalty −60, count penalty −10) describe different attack-surface shapes, so they are penalized separately. When both deteriorate, the penalties stack.
KEV penalty
min(40, KEV_count × 5) — −5 per open KEV-listed finding, capped at −40.
Final
Threat Score = max(0, min(200, ROUND(Base) − S_host_pen − S_find_pen − KEV_pen))
For the band logic, see the TER explainer; for the underlying priority, see TDL (Threat Discovery Level).
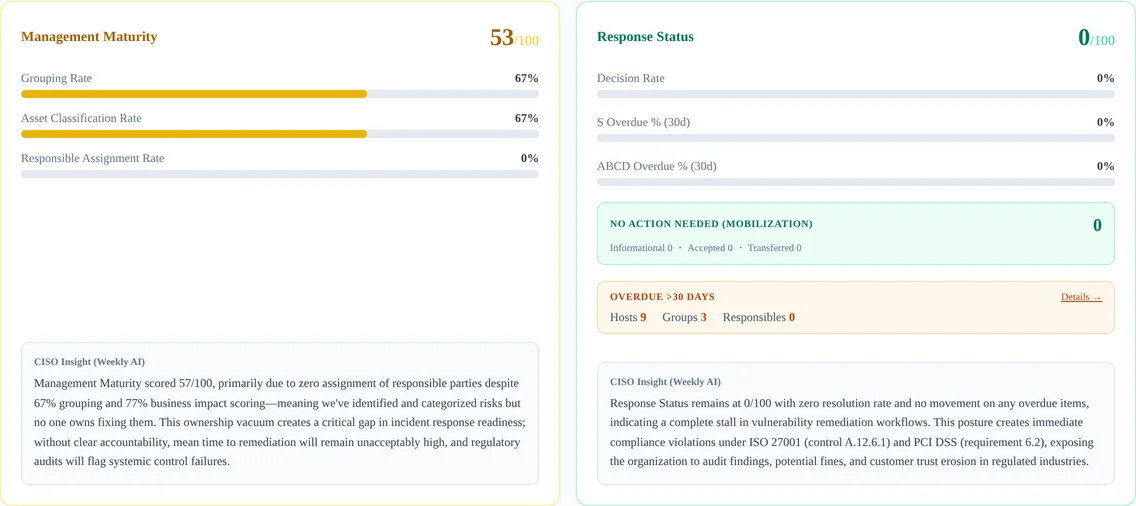
Management Maturity Score (100 points)
Each of the three rates has a maximum point allocation. A rate at 100% earns its full allocation, 50% earns half, 0% earns zero. The three earned points are summed into the Management Maturity Score.
| Rate | What it measures | Max points |
|---|---|---|
| Grouping Rate | percentage of active hosts assigned to an asset group | 40 |
| Asset Classification Rate | percentage of active hosts that carry at least one of the three BI Score tags (purpose / data_classification / availability) |
40 |
| Responsible Assignment Rate | percentage of asset groups under the contract that have a responsible person assigned (per group, not per host) | 20 |
Examples:
- All three at 100% → 40 + 40 + 20 = 100 points
- All three at 50% → 20 + 20 + 10 = 50 points
- Grouping 100% / Classification 70% / Responsible 50% → 40 + 28 + 10 = 78 points
Grouping and Asset Classification are the main drivers (40 max points each); Responsible Assignment plays a supporting role (20 max). The more these progress, the sharper the TER band judgment becomes (especially on the BI axis), and the clearer the chain of responsibility for remediation.
Response Status Score (100 points)
This axis evaluates the health of the response process for detected findings, excluding "informational" priority findings.
Formula
Response Status Score = max(0, Decision Rate − S Overdue % × 0.5 − ABCD Overdue % × 0.15)
All three rates are 0–100 numeric values used directly as "points" (floored at 0, capped at 100).
What each rate means
- Decision Rate: percentage of findings that have been marked as resolved or as no action needed
- Denominator counts every actionable finding (untouched, in progress, resolved, or no action needed); numerator is just the resolved + no-action-needed ones
- "Informational" priority findings are excluded
- When there are no actionable findings at all, the rate defaults to 100 (full marks)
- S Overdue %: among unresolved S-band findings, the percentage past the S deadline of 7 days from first discovery (weight 0.5, max −50 at 100%)
- ABCD Overdue %: among unresolved A–D band findings, the percentage past their band deadline from first discovery (A=14 / B=21 / C=28 / D=35 days) (weight 0.15, max −15 at 100%)
(Deadlines are derived automatically from the discovery date and the per-severity deadline — S=7 / A=14 / B=21 / C=28 / D=35 days. Because the band reflects business impact, the same vulnerability gets a shorter deadline on more critical assets.)
Example
Decision Rate 80% / S Overdue 40% / ABCD Overdue 20% → 80 − (40 × 0.5) − (20 × 0.15) = 80 − 20 − 3 = 57 points
This surfaces the "we detect but the work has stalled" state.
The two sub-sections of the Response Status panel
-
MOBILIZATION (No Action Needed): count of findings the user marked as "no action needed" on the Mobilization screen, broken down by the reason they selected:
- No impact in this environment
- False positive
- Other (any other free-text reason, or unset)
All three are findings the user marked as "no action needed," so they count toward the Decision Rate's numerator (alongside resolved findings). Informational-priority findings (auto-classified) are excluded from both MOBILIZATION and the Decision Rate.
-
Overdue: number of hosts, groups, and responsibles affected by findings past their per-severity deadline (S=7 / A=14 / B=21 / C=28 / D=35 days)
Indicators That Feed the Threat Score
The detection that powers the Threat axis is built from a wide range of indicators automatically collected during the ASM (Attack Surface Management) Discovery phase.
- SSL/TLS configuration: certificate validity, TLS version, cipher suites, HSTS
- Open ports and services: unnecessarily exposed ports, legacy protocols (FTP / Telnet, etc.), externally accessible admin panels
- Vulnerabilities: known CVEs, patch lag, software versions in use
- DNS configuration: SPF / DKIM / DMARC, DNSSEC, zone-transfer restrictions
- Information exposure: leaky error messages, directory listings, version disclosure, unnecessary HTTP headers
Each of these detections becomes a finding, gets classified into a TER band, and rolls up into the Threat score.
How to Read the Score
The Executive Dashboard displays the total score in three color tiers.
| Total score | Rating | Display color |
|---|---|---|
| 320–400 | Excellent | Green |
| 240–319 | Good | Yellow |
| 0–239 | Caution | Red |
When the total drops, check the breakdown to see which axis is responsible.
- Threat is low → many S/A-band findings → use the TER map to find where they cluster
- Management Maturity is low → asset information is incomplete → progress on grouping, asset classification, and owner assignment
- Response Status is low → remediation is stalled → revisit decision-making or reallocate response capacity
How to Improve the Score
The improvement levers map directly to each sub-score's formula.
Threat (200 points)
The more findings sit in the S/A bands, the lower the score. The core action is to reduce the count of high-priority findings. Concretely, you can resolve or accept them from the Mobilization screen, or run AI Deep Scan validation — findings classified as "unconfirmed" have their TDL lowered by one level, which moves them into a lower band.
Management Maturity (100 points)
The formula is Grouping Rate × 0.4 + Asset Classification Rate × 0.4 + Responsible Assignment Rate × 0.2. Lift each rate directly:
- Create asset groups and assign hosts → Grouping Rate
- Tag hosts with BI Score (Purpose / Data Classification / Availability) → Asset Classification Rate
- Assign a responsible person to each asset group → Responsible Assignment Rate (per group, not per host)
The two 0.4-weighted rates (Grouping and Asset Classification) deliver the biggest impact.
Response Status (100 points)
The formula is Decision Rate − (S Overdue % × 0.5 + ABCD Overdue % × 0.15), where the overdue rates act as a penalty.
- Lift Decision Rate: record a decision (closed = resolved, or accepted) for findings sitting in open / in_progress
- Lower the overdue rates: resolve within each band's deadline (S in 7 days, etc.). S-band findings (weight 0.5, 7-day deadline) come first.
Executive Reporting
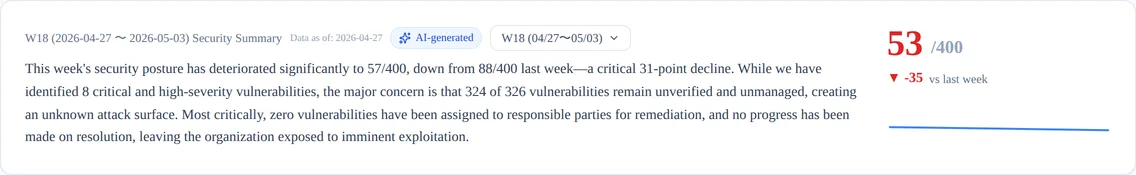
The Executive Dashboard itself is the weekly report for executives. By implementation, the same screen consolidates:
- Total score + week-over-week delta + trend line (header)
- The three sub-score breakdown (Threat / Management Maturity / Response Status, in red / yellow / green panels)
- AI-generated CISO insights for each panel, refreshed weekly (Total, Threat, Management Maturity, Response Status)
- Week selector to navigate snapshot history
There's no need to author a separate report — share this dashboard, or quote the AI-generated header summary directly in your weekly comms.
PentaTrail's Security Score
PentaTrail/CTEM covers the full CTEM framework, with the Executive Dashboard refreshing the 3-axis composite (400 points total) on a weekly cadence (What is CTEM?). For prioritization at the individual finding level, the TER band complements the score.
Learn more at our features page. To measure your score in practice, Start Your 14-Day Free Trial.
Visualize your attack surface with PentaTrail/CTEM
From discovery to vulnerability validation and remediation — all powered by the CTEM framework.
Get Started